# API reference
> The Markdown version of https://chartpng.dev/docs. The OpenAPI 3.1 spec is at https://chartpng.dev/openapi.json.
One endpoint, `/chart`. Send a Chart.js config as JSON and get a PNG back. The OpenAPI 3.1 spec is at [/openapi.json](https://chartpng.dev/openapi.json).
## Quick start
Put the URL in an `![]() `, an email, a Markdown file or a Slack message. No key is needed. Free images carry a small watermark.
```
 ```
The config never runs as code, so functions in it are not supported. Send JSON in Chart.js 4 syntax; the common options of a Chart.js v2 config, the kind QuickChart uses by default, are translated. The typical slips of language models are repaired for you (see [lenient parsing](https://chartpng.dev/docs#lenient-parsing)). A GET accepts QuickChart's parameter names `chart`, `width`, `height`, `backgroundColor` and `devicePixelRatio`. QuickChart's other parameters, such as `version`, `format` and `key`, are refused with a 400.
- Chart types: `bar`, `line`, `pie`, `doughnut`, `radar`, `polarArea`, `scatter`, `bubble`.
- Responses are PNG on success and `{"error": "..."}` on failure.
- Browsers can load images and call `/chart` from any site (CORS is open), but without the `Authorization` header. Use [signed URLs](https://chartpng.dev/docs#signed-urls) there.
## GET /chart
All parameters go in the query string. Unknown or repeated parameters are refused with a 400, so a URL cannot be varied to bypass the cache. A QuickChart name and its short name count as the same parameter.
| Parameter | QuickChart name | Type | Default | Notes |
| --- | --- | --- | --- | --- |
| `c` (required) | `chart` | string | none | Chart.js configuration as URL-encoded JSON, at most 16 KB, checked after any repair. Typical near-JSON from language models is repaired and the repairs are listed in the X-ChartPNG-Fixes response header; functions written as text are removed, never run. type is one of bar, line, pie, doughnut, radar, polarArea, scatter, bubble. Report presets are set in options.plugins.chartpng.preset: kpi, ranking, comparison, funnel or gauge. Their extra options sit beside it: previous (number, kpi only), max (number above 0, gauge only, default 100), prefix and suffix (strings around the kpi number, the ranking, funnel and gauge values; comparison does not use them), values (false hides the numbers a preset draws). funnel needs type bar and one dataset with a value per stage; gauge needs type doughnut and one dataset whose first number is the value. Anything the config sets wins over the preset. options.plugins.chartpng.theme is false, default, editorial, mono, colorblind, vivid or ocean; any other name is a 400. options.plugins.chartpng.palette is a list of 1 to 12 hex colours that replaces the theme's series colours. options.plugins.chartpng.preset also takes the output presets email and slack, alone or with a report preset as 'ranking,email'. The query parameters theme, palette and preset are the same settings; the config wins when both set one. Any other preset value is a 400 whose error message lists the valid presets. |
| `w` | `width` | integer, 50 to 2000 | `600` | Width in pixels. |
| `h` | `height` | integer, 50 to 2000 | `360` | Height in pixels. |
| `bkg` | `backgroundColor` | string | `#ffffff` | Background colour, any CSS colour, at most 32 characters. A longer value falls back to white. |
| `dpr` | `devicePixelRatio` | 1 or 2 | `1` | Device pixel ratio. 2 gives twice the pixels for retina screens. The free plan renders up to 4 megapixels (w x h x dpr squared). |
| `k` | none | string | none | Key id for a signed URL: the first 12 hex characters of the SHA-256 of the key. Send it with s. |
| `s` | none | string | none | Signature for a signed URL: the first 32 hex characters of an HMAC-SHA256 over [c, w, h, bkg, dpr] as they appear in the URL, with [theme, palette, preset] added after them when the URL has any of the three. Changing any of them invalidates it. Send it with k. |
| `theme` | none | default or editorial or mono or colorblind or vivid or ocean or false | `default` | Named theme: default, editorial, mono, colorblind, vivid or ocean; false turns the ChartPNG look off. The same as options.plugins.chartpng.theme, which wins when the config sets it. Light or dark colours follow bkg. Any other name is a 400. |
| `palette` | none | string | none | Series colours, comma-separated hex: 1f5fad,e0712c,13896f. The # is optional (in a URL it must be written %23). 1 to 12 colours, #rgb or #rrggbb; anything else is a 400. Replaces the theme's colours for datasets that set none. The same as options.plugins.chartpng.palette, which wins when the config sets it. |
| `preset` | none | string | none | Report preset (kpi, ranking, comparison) and/or output preset (email, slack), at most one of each, comma-separated: ranking,email. An output preset sets w, h, dpr and bkg when the request leaves them out (email 600 x 360 at dpr 2, slack 800 x 400 at dpr 2; a transparent bkg becomes white), gives the image roomier margins and keeps all type at 11 px or more. The same as options.plugins.chartpng.preset; for each of the two kinds the config wins when it sets one. |
With a GET, `k` and `s` make a signed URL for a Pro key. See [signed URLs](https://chartpng.dev/docs#signed-urls).
## POST /chart
The same fields in a JSON body of at most 20 KB. Use it for configs too long for a URL and for server-side calls with a Pro key.
- Send `Content-Type: application/json`. The name `c` may hold the config as an object or as a JSON string.
- Send `Authorization: Bearer ` for a Pro key. The response is then `Cache-Control: private, no-store`.
- Field names are the short ones only. QuickChart names are not mapped in a body, and unknown fields are ignored.
- A body that is not a JSON object is answered as if `c` were missing.
A missing or unknown key is not an error. The chart is drawn with the watermark, as on the free plan.
## POST /chart.json
The same body as `POST /chart`, but nothing is drawn. It answers with the public URL of the free plan and the text and snippets to paste the image in a page, an email or Slack. No key is needed.
```
curl https://chartpng.dev/chart.json \
-H "Content-Type: application/json" \
-d '{"c":{"type":"bar","data":{"labels":["Mon","Tue","Wed"],"datasets":[{"label":"Signups","data":[12,19,7]}]}},"w":600,"h":360}'
```
```
{ "url": "https://chartpng.dev/chart?c=...&w=600&h=360", "alt": "Bar chart: ...", "markdown": "", "html": "
 ", "fixes": [] }
```
- `fixes` lists the codes of the repairs applied to the config, the same ones `GET /chart` puts in `X-ChartPNG-Fixes` (see [lenient parsing](https://chartpng.dev/docs#lenient-parsing)), and is an empty list when nothing was repaired. The [QuickChart converter](https://chartpng.dev/recipes/from-quickchart/convert) reads it.
- Validation and limits are those of `/chart`, with the same errors. The URL is the free plan's, so it has the watermark and the 4 megapixel limit, and it carries the config as repaired by [lenient parsing](https://chartpng.dev/docs#lenient-parsing). The config is drawn once to check it, so a theme or preset that does not exist or numbers too large to draw get their 400 here and not when the image is fetched. A large config makes a long URL, about twice the size of the config. Over 14,000 characters you get a 400 with `url_too_long`: Vercel's CDN answers 414 above 14 KB, so use `POST /chart` instead. Slack's image block accepts an `image_url` of at most 3000 characters, which a config of about 1.5 KB already reaches.
- `alt` is built from values in your data, with no model: chart type, title, number of series, the highest value with its label, the last value and, for `line`, the change from first to last. It has at most 2000 characters, the limit of Slack's image `alt_text`. Use it as is.
- `html` escapes quotes and `<` in the alt. Its `width` and `height` are CSS sizes, so a `dpr` of 2 does not double them.
- `GET /chart` and `POST /chart` answer with the same text in the `X-Chart-Alt` header, percent-encoded: read it with `decodeURIComponent`. Browsers can read it from any site.
## Short URLs
`POST /c` takes the same body as `POST /chart`, keeps the chart for 90 days and answers with a short image URL, `https://chartpng.dev/c/{id}.png`. The URL stays short however large the config is, so it fits Slack's 3000-character `image_url`, emails and Markdown.
```
curl https://chartpng.dev/c \
-H "Content-Type: application/json" \
-d '{"c":{"type":"bar","data":{"labels":["Mon","Tue","Wed"],"datasets":[{"label":"Signups","data":[12,19,7]}]}},"w":600,"h":360}'
```
```
{ "id": "Ab3dE5gH7jK", "url": "https://chartpng.dev/c/Ab3dE5gH7jK.png", "expires": "2027-02-01T09:00:00.000Z", "alt": "Bar chart: ...", "markdown": "", "html": "" }
```
- Validation, limits and errors are those of `/chart`. The config is stored as repaired by [lenient parsing](https://chartpng.dev/docs#lenient-parsing), with the `X-ChartPNG-Fixes` header on the answer, and it is drawn once to check it, so errors that only show when drawing get their 400 here.
- `GET /c/{id}.png` draws the stored chart exactly as `/chart` would, with the same `X-Chart-Alt` header. Unknown or expired ids get a 404, and a query string a 400.
- The same chart sent again gets the same id and another 90 days from that moment. Ids come from a hash of the chart, so they cannot be guessed one after another.
- Send `Authorization: Bearer ` to make the short URL with a Pro key. The image then has no watermark for as long as the key stays paid; if the key is cancelled or blocked, the same URL draws with the watermark. The key never appears in the URL. Signed fields (`k`, `s`) are ignored here.
- Each address can make 200 short URLs a month on the free plan, and each Pro key 5,000. Free short URLs also share a daily storage budget. Past either limit, `POST /c` answers 429; `POST /chart.json` and `POST /chart` still work.
- The image is cached like a `/chart` image, until the short URL expires: `Cache-Control: public, max-age=86400, s-maxage=` the seconds left`, immutable`.
- Each fetch of a short URL that is not served from the cache counts as a render, like `/chart`.
## Signed URLs
Chart images end up in emails and on public pages, and anyone who sees the page sees the URL. So the key never goes in a URL. A signed URL carries two values instead: `k`, an id derived from the key by a hash, and `s`, an HMAC-SHA256 of`c`, `w`, `h`, `bkg` and `dpr` made with the key. The server checks it and draws without the watermark.
- Change any of those five values and the signature stops matching. The image is drawn with the watermark.
- `theme`, `palette` and `preset` are signed too, after those five, when the URL has any of them. A URL without them is signed as it always was, so URLs signed earlier keep working. Add, drop or change one of the three and the signature stops matching. Settings inside `c` are covered with it.
- Someone who copies the URL can reuse that one chart, not your key and not other charts.
- Sign on your server. A key in browser code is a leaked key.
- The `@chartpng/client` npm package does the signing. Run `npm install @chartpng/client`; it needs Node 22 or later.
- Keep URLs under 8,000 characters. Some email clients break past that. For large data, use `renderChart` or `POST` and attach the PNG.
```
import { chartUrl } from '@chartpng/client';
const config = {
type: 'bar',
data: {
labels: ['Mon', 'Tue', 'Wed'],
datasets: [{ label: 'Signups', data: [12, 19, 7] }],
},
};
// Runs on your server. The URL carries k and s, never the key.
const url = chartUrl(config, {
apiKey: process.env.CHARTPNG_API_KEY,
width: 600,
height: 360,
dpr: 2,
});
```
## Limits
| What | Limit |
| --- | --- |
| Chart config | 16 KB, in GET and in POST |
| POST body | 20 KB. Larger bodies get a 413. |
| Width and height | 50 to 2000 px, whole numbers |
| dpr | 1 or 2 |
| Free plan size | 4 megapixels: w × h × dpr². For example 2000 × 2000 at dpr 1. |
| Pro size | Up to 2000 × 2000 at dpr 2 |
| `ticks.count`, `ticks.maxTicksLimit` | At most 100 |
| Nesting | At most 16 levels |
| Parameters | Only those in the table. Unknown or repeated ones get a 400. This applies to GET. |
| Short URLs | Kept 90 days from the last `POST /c` of the same chart. 200 a month per address on the free plan, 5,000 per Pro key. |
| Background | `bkg` up to 32 characters. A longer value is ignored and the background is white. |
## Errors
Every error is JSON, `{"error": "..."}`, with CORS headers so browsers can read it. Nothing is drawn when a request is refused.
| Status | Message | When |
| --- | --- | --- |
| 400 | `unknown parameter: x` | A GET query has a name that is not in the table above. |
| 400 | `parameter given twice: c` | The same parameter, or a parameter and its alias, appears twice. |
| 400 | `missing chart config (c)` | No c, or a POST body that is not a JSON object. |
| 400 | `chart config must be valid JSON` | c is a string that does not parse, even after the repairs under lenient parsing. |
| 400 | `chart config is larger than 16 KB` | c is over the limit, as a string or as an object. |
| 400 | `type must be one of: bar, line, pie, doughnut, radar, polarArea, scatter, bubble` | Any other chart type. |
| 400 | `chart config needs a data object` | The config has no data. |
| 400 | `chart config is nested deeper than 16 levels` | Objects inside objects past 16 levels. |
| 400 | `ticks.count must be at most 100` | Also for ticks.maxTicksLimit. |
| 400 | `options.scales.x.ticks must be an object` | Chart.js failed to draw because a value is not an object where it needs one: options.plugins.legend, or ticks, grid, border or title of a scale. The message names the path. A hidden axis that never reads the value still draws. |
| 400 | `width and height must be integers between 50 and 2000` | w or h is out of range or not a whole number. |
| 400 | `dpr must be 1 or 2` | Any other pixel ratio. |
| 400 | `the free plan renders up to 4 megapixels (w × h × dpr²); a Pro key lifts it` | Free image over 4 megapixels. |
| 400 | `unknown preset "x"; valid presets: kpi, ranking, comparison, funnel, gauge, email, slack` | preset, or options.plugins.chartpng.preset, has a name that is not one of the seven. |
| 400 | `preset takes at most one of email, slack` | Two output presets, or two report presets (kpi, ranking, comparison, funnel, gauge), in one preset value. One of each kind is fine: ranking,email. |
| 400 | `unknown theme "x"; valid themes: default, editorial, mono, colorblind, vivid, ocean` | theme, or options.plugins.chartpng.theme, is not false and not one of the six names. |
| 400 | `palette must be 1 to 12 hex colours such as 1f5fad,e0712c (#rgb or #rrggbb); got "x"` | palette, or options.plugins.chartpng.palette, has a colour that is not hex, an empty item, or fewer than 1 or more than 12 colours. |
| 400 | `preset kpi needs type line or bar` | The config does not fit its preset. The message names the preset and what is wrong, such as the type or the number of datasets. |
| 413 | `request body is larger than 20 KB` | A POST body over the limit. Checked before parsing. |
| 400 | `numbers in the chart are too large to draw` | A value or axis end above 1e300. Chart.js cannot step an axis that wide. |
| 400 | `could not draw this chart with these options` | Chart.js threw while drawing, usually an option of the wrong shape (an array where it expects an object). |
| 500 | `could not render this chart` | Something failed on our side. The details stay on the server. |
| 429 | `this address has made its 200 short URLs this month; ...` | POST /c past the monthly cap of short URLs: 200 per address on the free plan, 5,000 per Pro key. |
| 429 | `free short URLs are used up for today; ...` | POST /c without a key once the day's storage for free short URLs is used up. It frees again the next day (UTC). |
| 503 | `short URLs are unavailable right now; ...` | POST /c or GET /c/{id}.png while storage cannot be reached. /chart keeps working. |
A report preset that is unknown, or that does not fit the config, is also a 400. The body carries only the `error` message; `bad_preset` (and `bad_option` for the shape errors above) is the internal reason these errors are counted under, not a field you can read. See [report presets](https://chartpng.dev/docs#presets).
## Theme
A config that does not style itself gets the ChartPNG look. Anything your config sets wins over it.
- A blue and orange palette for datasets without `backgroundColor` or `borderColor`.
- Horizontal grid lines only, rounded bars, smooth lines with a soft area under a single line.
- Legend at the top left when a series has a name or there are several. Pie and doughnut put it on the right.
- Values drawn on the chart: above bars (up to 2 datasets and 12 labels), at the last point of a line, and the total inside a doughnut.
- Light text on dark backgrounds. `bkg` as `black`, `#rgb`, `#rrggbb` or `rgb()` counts as dark below mid-grey.
Turn the whole theme off with `options.plugins.chartpng.theme` set to `false` (or the parameter `theme=false`). Chart.js then draws your config as it is.
```
{
"type": "bar",
"data": { "labels": ["Mon", "Tue"], "datasets": [{ "data": [12, 19] }] },
"options": { "plugins": { "chartpng": { "theme": false } } }
}
```
Keep the theme and drop only the numbers drawn on the chart with `values` set to `false`:
```
"options": { "plugins": { "chartpng": { "values": false } } }
```
## Named themes
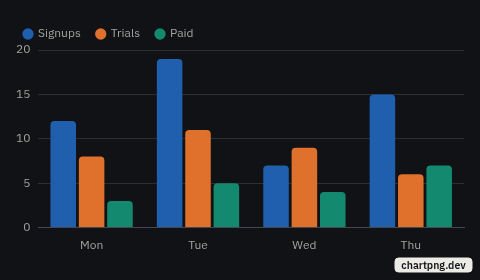
Pick one of six palettes with the `theme` parameter, or with `options.plugins.chartpng.theme` in the config. They are the same setting: when both are set, the config wins. Light or dark is chosen from `bkg` as in the theme above, and colours your datasets set still win. An unknown name is a 400. `false` still turns the theme off.
```
https://chartpng.dev/chart?c={...}&theme=ocean
```
```
{ options: { plugins: { chartpng: { theme: 'editorial' } } } }
```
Every theme colour is checked in the test suite against two light backgrounds (white and paper) and two dark ones (near-black and black), with the WCAG contrast formula: text is at least 4.5:1. Series colours of `vivid`, `ocean` and `editorial`, and the dark variants of `mono` and `colorblind`, are at least 3:1. The `default` palette and the light variants of `mono` and `colorblind` keep a few colours below that (the Okabe-Ito yellow, for one), listed in that test. A custom `palette` is not checked: contrast is yours to judge.
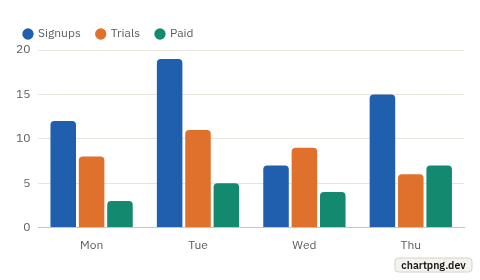
`default`
The look above. Same as no theme at all.
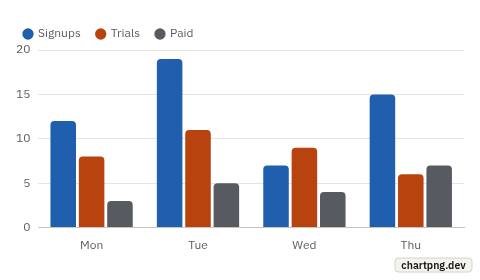
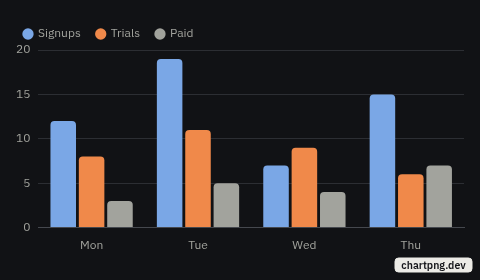
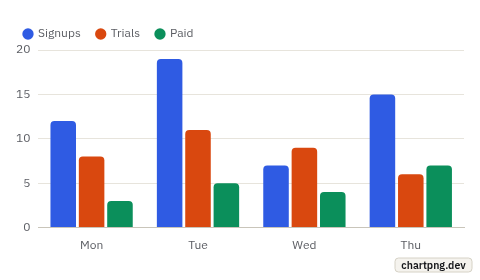
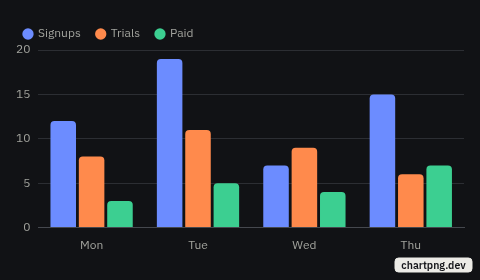
`editorial`
Blue, rust and grey, with lighter tones on dark backgrounds.
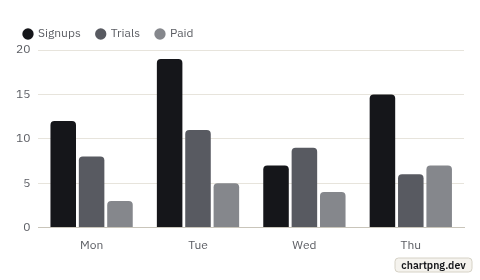
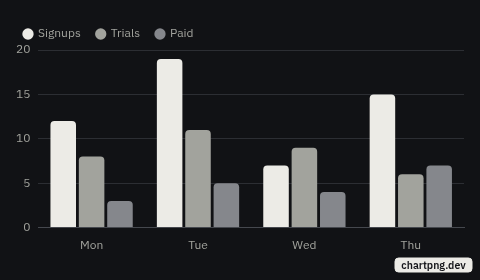
`mono`
Ink, grey and paper tones. On dark backgrounds the greys run from paper to mid grey.
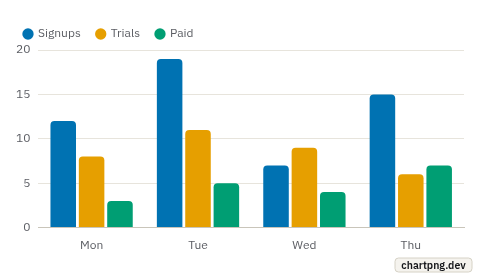
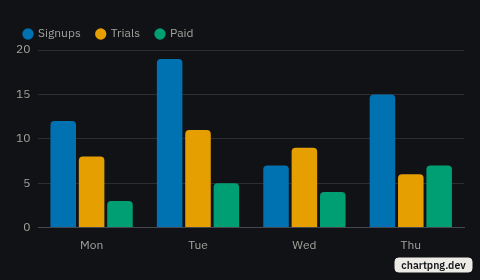
`colorblind`
The Okabe-Ito palette, chosen to stay apart for colour-blind readers. Its black becomes light ink on dark backgrounds.
`vivid`
Saturated blue, orange, green and purple for dashboards and slides. Lighter tones on dark backgrounds.
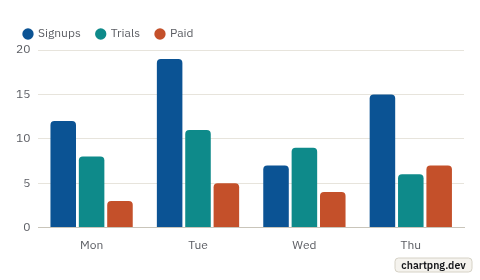
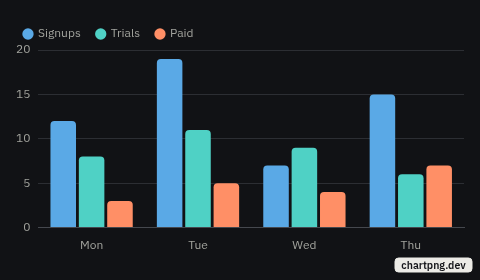
`ocean`
Blues and teal with a coral accent, then olive, violet and ochre. Lighter tones on dark backgrounds.
## Palette
Your own series colours: `palette` as a parameter, or `options.plugins.chartpng.palette` in the config as a list or a comma-separated string. It replaces the theme's colours for datasets that set none, on light and dark backgrounds alike; the rest of the theme stays. When both are set, the config wins.
- 1 to 12 colours, `#rgb` or `#rrggbb`. The `#` is optional: in a URL it must be written `%23`, so `palette=1f5fad,e0712c` is easier.
- With more series than colours, the colours repeat in order. Pie and doughnut slices use them in order too, and the ranking preset highlights its first bar with the first.
- Anything else is a 400, with the message in the errors table: a colour name, an alpha channel (`#rrggbbaa`), an empty item, no colour or more than 12.
```
https://chartpng.dev/chart?c={...}&palette=1f5fad,e0712c,13896f
https://chartpng.dev/chart?c={...}&palette=%231f5fad,%23e0712c
{ options: { plugins: { chartpng: { palette: ['#1f5fad', '#e0712c', '#13896f'] } } } }
```
## Report presets
A preset turns a plain config into a report image: a KPI, a ranking, a comparison, a funnel or a gauge. Set it under `options.plugins.chartpng`. No new chart types: a preset is a ready-made set of Chart.js options on top of the theme. Anything your config sets wins over the preset.
| Preset | What it draws |
| --- | --- |
| `kpi` | A big number with the last value of the first dataset, a change chip against `previous` (or against the first value when `previous` is not set), and a sparkline without axes. |
| `ranking` | Horizontal bars ordered from highest to lowest, the first one highlighted. |
| `comparison` | Two datasets: the first is the current period and the second the previous one, in grey, with the percentage change shown on the current period. |
| `funnel` | Type `bar`, one dataset with a value per stage (up to 12, none negative). One centred bar per stage from top to bottom, as wide as its value, with the value and the share of the previous stage beside it. |
| `gauge` | Type `doughnut`, one dataset whose first number is the value. A half ring filled up to `max`, with the value big in the middle and the share of `max` under it. |
| Option | Type | Notes |
| --- | --- | --- |
| `preset` | string | `kpi`, `ranking`, `comparison`, `funnel` or `gauge`; also `email` or `slack`, see [output presets](https://chartpng.dev/docs#output-presets). The `preset` parameter is the same setting. Any other value is a 400, see the errors table. |
| `previous` | number | Only for `kpi`. The value the change chip compares with. |
| `max` | number | Only for `gauge`. A number above 0: the value at which the ring is full, such as a goal. Default `100`. Anything else is a 400. |
| `values` | boolean | `false` hides the numbers the preset draws (ranking values, comparison changes, funnel values, gauge number). |
| `prefix` | string | `kpi`: put before the big number. `ranking`, `funnel`: put before each value. `gauge`: before the value and the goal. Such as `"$"`. Not used by `comparison`. |
| `suffix` | string | `kpi`: put after the big number. `ranking`, `funnel`: put after each value. `gauge`: after the value and the goal. Such as `"%"`. Not used by `comparison`. |
```
{
"type": "line",
"data": { "labels": ["W1", "W2", "W3"], "datasets": [{ "label": "MRR", "data": [8200, 9100, 9840] }] },
"options": { "plugins": { "chartpng": { "preset": "kpi", "previous": 9100, "prefix": "$" } } }
}
```
One guide for each preset, with a config, a GET URL and a curl example: [KPI with a sparkline](https://chartpng.dev/guides/kpi-sparkline), [ranking chart](https://chartpng.dev/guides/ranking-chart) [comparison with the previous period](https://chartpng.dev/guides/period-comparison), [funnel chart](https://chartpng.dev/guides/funnel-chart) and [gauge chart](https://chartpng.dev/guides/gauge-chart). An n8n workflow that posts them to Slack is in the [n8n guide](https://chartpng.dev/guides/n8n), and the Slack message itself in [Charts in Slack](https://chartpng.dev/guides/charts-in-slack).
## Output presets
A report preset says what the chart is; an output preset says where the image is going. They share the name `preset` and no values, so one request can have one of each, separated by a comma: `preset=ranking,email`. Use the `preset` parameter, or `options.plugins.chartpng.preset` in the config as `"email"` or `"ranking,email"`. For each kind, the config wins when both set one.
| Preset | Image | For |
| --- | --- | --- |
| `email` | 600 × 360 at `dpr` 2: a 1200 × 720 pixel PNG, to show at 600 pixels wide. | An `
![]() ` in an email: sharp on retina screens. The [email guide](https://chartpng.dev/guides/charts-in-email) explains the sizing. |
| `slack` | 800 × 400 at `dpr` 2: a 1600 × 800 pixel PNG. | A Slack image block, with the sizes of the [Slack guide](https://chartpng.dev/guides/charts-in-slack). Slack documents no pixel size for the block: this is our convention, not a limit. The 3000 character limit on `image_url` still applies. |
- `w`, `h` and `dpr` that the request sends win; the preset only fills in what is missing. `bkg` that the request sends is kept, unless it is transparent (`transparent`, an empty value, `rgba()` or a hex colour with alpha below 1): inboxes and chats draw their own colour behind an image, so the background becomes white.
- Roomier margins around the chart than the default look, and no type below 11 pixels: a font size under 11 in your config is raised to 11, and so is the type of the watermark. A report preset that lays out its own margins, such as `kpi`, keeps them.
- The header row is yours: the title, the subtitle and the `source` line come from `options.plugins.title`, `options.plugins.subtitle` and `options.plugins.chartpng.source`. The preset adds none.
- `theme: false` keeps the size, the pixel ratio and the background, and drops the margins and the type floor.
- An unknown value, or two of one kind (`email,slack`), is a 400, see the errors table.
- `POST /chart.json` puts `preset=email` in the URL it returns, with `w`, `h` and `dpr` written out, and an `html` snippet at the CSS size.
```
https://chartpng.dev/chart?c={...}&preset=email
https://chartpng.dev/chart?c={...}&preset=ranking,slack&w=640
{ options: { plugins: { chartpng: { preset: 'ranking,email' } } } }
```
```
 ```
## Lenient parsing
Models write almost-JSON. ChartPNG repairs the usual slips before it reads the config, and tells you what it changed in the`X-ChartPNG-Fixes` response header: the codes of the repairs applied, separated by commas. When nothing was repaired the header is absent. If a config cannot be repaired, the request is refused with the same clear error as always.
| Code | What was repaired |
| --- | --- |
| `code_fence` | The config came wrapped in a Markdown code fence. The fence is removed. |
| `trailing_comma` | A comma before a closing bracket or brace. It is removed. |
| `single_quotes` | Strings in single quotes become double-quoted strings. |
| `unquoted_keys` | Object keys without quotes get quotes. |
| `double_encoded` | The config was JSON inside a JSON string. It is decoded once. |
| `function_string` | A function written as text is removed. |
| `v2_scales` | A Chart.js v2 axis, `scales.xAxes[0]` or `scales.yAxes[0]`, became `scales.x` or `scales.y`: `gridLines` is now `grid` (and `gridLines.drawBorder` is `border.display`), `scaleLabel.labelString` is `title.text`, `ticks.beginAtZero`, `min`, `max`, `suggestedMin`, `suggestedMax` and `reverse` sit on the scale, and `fontColor`, `fontSize`, `fontStyle` and `fontFamily` of the ticks and the title become `color` and `font`. A list of several axes becomes one entry per id, when every axis has an id and every dataset names one of them. An axis already keyed `x` or `y` that still holds `gridLines` or `scaleLabel` gets them renamed. Only on bar, line, scatter and bubble charts, when no dataset names a single axis by id and the v4 key is not there yet. |
| `v2_plugins` | `options.legend`, `options.title` or `options.tooltips` moved to `options.plugins.legend`, `title` or `tooltip` when written as an object, unless that plugin was already set; the font options of the legend labels and the title become `color` and `font`. A bare `legend: false` is left as it came. |
| `v2_datasets` | The dataset option `steppedLine` became `stepped`, with the same values. |
| `v2_defaults` | A Chart.js v2 line chart whose datasets do not say `fill` got `options.elements.line.fill: true`, because Chart.js 2 filled the area under a line by default and Chart.js 4 does not. Only when another v2 option was translated in the same config, so a v4 config never gets it, and a `fill` on a dataset or in `elements.line` wins. A chart that sets no colors keeps the ChartPNG theme's own fill. |
| `missing_type` | The config had no `type` but had datasets, so it was drawn as `bar`. This one is a guess: set `type` if you meant another chart. |
- Functions are never run. A function written as text is removed from the config. Nothing in the config is evaluated.
- The limits apply after the repair: 16 KB, 16 levels of nesting and 100 ticks.
- Browsers can read `X-ChartPNG-Fixes` from another site: it is exposed with `Access-Control-Expose-Headers`.
- A code in the header means the config you sent was not strict JSON. Send the corrected form next time.
```
curl -si -G https://chartpng.dev/chart \
--data-urlencode "c={type:'bar',data:{labels:['Mon','Tue'],datasets:[{data:[12,19],}]}}" \
| grep -i '^x-chartpng-fixes'
# x-chartpng-fixes: trailing_comma,single_quotes,unquoted_keys
```
## Caching
- The same URL gives the same image. A GET without a Bearer header is answered with `Cache-Control: public, max-age=86400, s-maxage=31536000, immutable`: browsers keep it a day and the CDN keeps it up to a year.
- Any change to the URL is a new render. To refresh a chart, change something in `c`.
- A request with a Bearer header is answered with `private, no-store`. Nothing shared keeps it.
- The cache can be emptied when the service is redeployed, so an old URL may be drawn again later.
## Examples
### curl
GET, free plan:
```
curl -G https://chartpng.dev/chart \
--data-urlencode 'c={"type":"bar","data":{"labels":["Mon","Tue","Wed"],"datasets":[{"label":"Signups","data":[12,19,7]}]}}' \
-d w=600 -d h=360 -d dpr=2 \
-o chart.png
```
POST with a Pro key:
```
curl https://chartpng.dev/chart \
-H "Authorization: Bearer $CHARTPNG_API_KEY" \
-H "Content-Type: application/json" \
-d '{"c":{"type":"bar","data":{"labels":["Mon","Tue","Wed"],"datasets":[{"label":"Signups","data":[12,19,7]}]}},"w":600,"h":360,"dpr":2}' \
-o chart.png
```
### Node
With `fetch` (Node 18 or later; the `@chartpng/client` package needs 22):
```
import { writeFile } from 'node:fs/promises';
const config = {
type: 'bar',
data: {
labels: ['Mon', 'Tue', 'Wed'],
datasets: [{ label: 'Signups', data: [12, 19, 7] }],
},
};
const res = await fetch('https://chartpng.dev/chart', {
method: 'POST',
headers: {
'Content-Type': 'application/json',
Authorization: 'Bearer ' + process.env.CHARTPNG_API_KEY,
},
body: JSON.stringify({ c: config, w: 600, h: 360, dpr: 2 }),
});
if (!res.ok) throw new Error((await res.json()).error);
await writeFile('chart.png', Buffer.from(await res.arrayBuffer()));
```
With the `@chartpng/client` package. `chartUrl` is under [signed URLs](https://chartpng.dev/docs#signed-urls); `renderChart` returns the PNG bytes:
```
import { writeFile } from 'node:fs/promises';
import { renderChart } from '@chartpng/client';
const config = {
type: 'bar',
data: {
labels: ['Mon', 'Tue', 'Wed'],
datasets: [{ label: 'Signups', data: [12, 19, 7] }],
},
};
// Same call as the fetch above. Throws "ChartPNG 400: ..." on an error.
const png = await renderChart(config, { apiKey: process.env.CHARTPNG_API_KEY, width: 600, height: 360, dpr: 2 });
await writeFile('chart.png', png);
```
### Python
```
import os
import requests
config = {
"type": "bar",
"data": {
"labels": ["Mon", "Tue", "Wed"],
"datasets": [{"label": "Signups", "data": [12, 19, 7]}],
},
}
res = requests.post(
"https://chartpng.dev/chart",
headers={"Authorization": f"Bearer {os.environ['CHARTPNG_API_KEY']}"},
json={"c": config, "w": 600, "h": 360, "dpr": 2},
timeout=20,
)
if not res.ok:
raise RuntimeError(res.json()["error"])
with open("chart.png", "wb") as f:
f.write(res.content)
```
## MCP server
The `@chartpng/mcp` server lets an AI agent draw charts. It needs Node 22 or later. It has two tools: `chart_url` returns a public PNG URL, signed if you set a key, and `render_chart` returns the image.
Claude Code:
```
claude mcp add -s user -e CHARTPNG_API_KEY=your-key chartpng -- npx -y @chartpng/mcp@0.2.0
```
Claude Desktop, Cursor and other clients, in their `mcpServers` config:
```
{
"mcpServers": {
"chartpng": {
"command": "npx",
"args": ["-y", "@chartpng/mcp@0.2.0"],
"env": { "CHARTPNG_API_KEY": "optional, removes the watermark" }
}
}
}
```
Keep the key in your user-level config, not in a project file that gets committed. Without a key it works and images carry the watermark. `CHARTPNG_BASE_URL` changes the server, and defaults to `https://chartpng.dev`.